的MSChart:如何显示日历周数作为在X轴标签?日历、标签、MSChart
我需要的格式时间轴的标签中的MSChart像CW21,CW22......我挣扎了一段时间,但没有找到任何解决办法呢。
I need to format the labels of the time axis in a MSChart like "CW21", "CW22", ... I am struggling for a while and could not find any solution yet.
有一个 LabelStyle.Format 属性,但这种不支持(据我所知)日历周。它使用的DateTime格式字符串。有没有一种方法来介绍自定义格式?
There is a LabelStyle.Format property but this does not support (AFAIK) calendar weeks. It uses the DateTime formatting strings. Is there a way to introduce a custom formatter?
在框架内,我发现 Calendar.GetWeekOfYear 的方法,它会为我提供正确的周数。现在的问题是如何将这些结合在一起?
In the framework I found the Calendar.GetWeekOfYear method, which would provide me with the right week number. Now the question is how to bring these together?
有没有什么好的策略来设置自己的轴标签在通用的方式? (不预先知道的最小/轴的最大点)
Is there any good strategy to setup one's own labels on the axis in a generic manner? (without knowing in advance the min/max points of the axis)
推荐答案
是的,你可以使用Chart.FormatNumber事件例如:
Yes, you can use the Chart.FormatNumber event e.g.:
private void FillChart()
{
    // register the format event
    this.chart1.FormatNumber += new EventHandler<FormatNumberEventArgs>(chart1_FormatNumber);

    // fill the data table with values
    DataTable dt = new DataTable();
    dt.Columns.Add("X", typeof(DateTime));
    dt.Columns.Add("Y", typeof(double));

    dt.Rows.Add(DateTime.Today.AddDays(1), 10);
    dt.Rows.Add(DateTime.Today.AddDays(8), 30);
    dt.Rows.Add(DateTime.Today.AddDays(15), 10);
    dt.Rows.Add(DateTime.Today.AddDays(21), 20);
    dt.Rows.Add(DateTime.Today.AddDays(25), 40);
    dt.Rows.Add(DateTime.Today.AddDays(31), 25);

    // bind the data table to chart
    this.chart1.Series.Clear();

    var series = this.chart1.Series.Add("Series 1");
    series.XValueMember = "X";
    series.YValueMembers = "Y";

    series.ChartType = SeriesChartType.Line;
    this.chart1.DataSource = dt;
    this.chart1.DataBind();

    // set a custom format to recognize the AxisX label in the event handler
    this.chart1.ChartAreas[0].AxisX.LabelStyle.Format = "CustomAxisXFormat";

}

void chart1_FormatNumber(object sender, FormatNumberEventArgs e)
{
    if (e.ElementType == ChartElementType.AxisLabels &&
        e.Format == "CustomAxisXFormat")
    {
        if (e.ValueType == ChartValueType.DateTime)
        {
            var currentCalendar = CultureInfo.CurrentCulture.Calendar;
            e.LocalizedValue = "CW" +
                currentCalendar.GetWeekOfYear(DateTime.FromOADate(e.Value),
                System.Globalization.CalendarWeekRule.FirstDay,
                CultureInfo.CurrentCulture.DateTimeFormat.FirstDayOfWeek);
        }
    }
}
下面的结果:
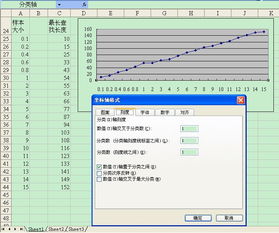
Here's the result: